How to Read Diagnostic Logs Related to Auto Particulate Filter Regenerations
Understanding the purpose of diagnostic logs for particulate filter systems
Knowing how to read diagnostic logs is essential when diagnosing issues with a vehicle’s particulate filter. Modern vehicles record detailed events during normal operation and during forced or passive DPF regeneration. These logs help technicians and informed owners identify whether a problem is intermittent, sensor-driven, or caused by driving patterns that prevent proper regeneration.
Diagnostic logs capture parameters such as soot load, back pressure, exhaust temperature, and the status of the regeneration process. If you own a car described in another language as filtre a particules voiture, these same principles apply — the log entries will indicate the same core values and events, even if some labels are manufacturer-specific.
Key log fields to look for in regeneration records
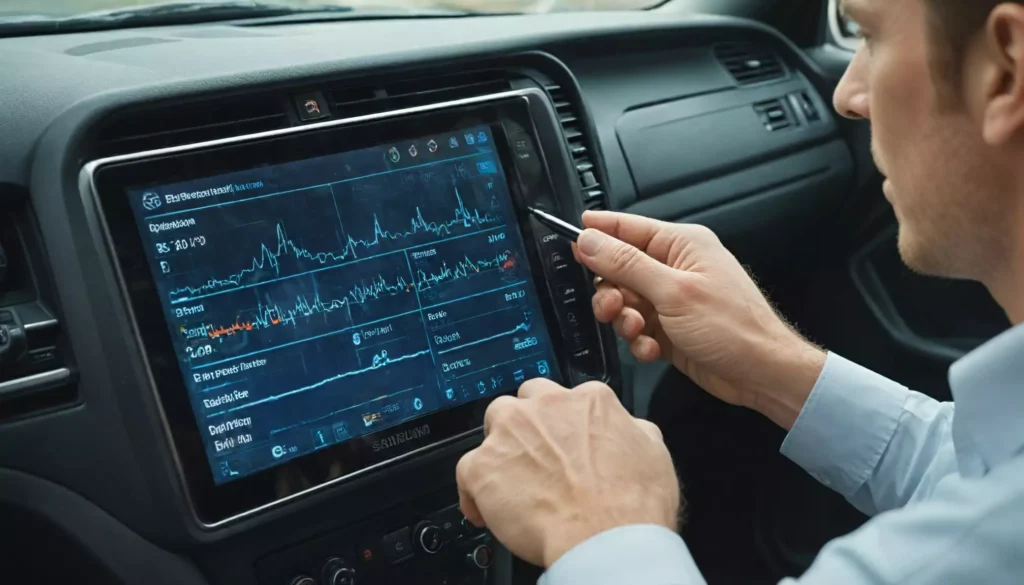
When you open a diagnostic log file or view live data, focus first on the core columns: timestamp, engine RPM, vehicle speed, exhaust temperature (pre- and post-filter), soot load percentage or grams, and any regeneration status flags. These are the signals that most directly indicate whether a regeneration event occurred and whether it completed successfully.
Also check for error codes such as P24xx/P2000-range codes that pertain to the particulate filter or related sensors. Manufacturer proprietary codes may appear alongside standard OBD-II codes; cross-referencing the code definitions in a repair manual or OEM database will speed up accurate interpretation.
Common regeneration patterns and how to recognize them in logs
A successful passive regeneration will generally show a gradual increase in exhaust temperature and a corresponding drop in soot load. In the logs this looks like a sustained high temperature range at cruising speeds and decreasing soot values across several minutes to tens of minutes. Passive events often have no explicit “start” or “stop” flag — they’re inferred from sensor trends.
Active or forced regenerations produce clearer markers: a rapid spike in fuel injection or injector pulse changes, a sharp rise in exhaust temperature, and a discrete regeneration status flag in the controller. If the regeneration fails, logs may show repeated attempts, rising back pressure, or an unchanged soot load despite elevated temperatures.
Interpreting related sensor data and fault codes
To read a diagnostic log effectively, correlate sensor readings with fault codes. For example, a logged DPF regeneration attempt accompanied by a code for a failed NOx sensor or temperature sensor suggests the controller may terminate the regeneration early. Similarly, sustained high differential pressure readings during and after a regeneration indicate incomplete ash/soot removal.
Look for time-synced events: a code thrown at the same timestamp as a regeneration start is usually related, whereas a code occurring hours later may be a secondary symptom. Understanding how the controller logs DPF regeneration status flags (start, in-progress, complete, failed) is crucial to determining root cause rather than treating symptoms.
Step-by-step checklist for analyzing a regeneration log
Use a systematic approach when you inspect logs so you don’t miss subtle indicators of trouble. Start with broad trends, then zoom in on the timestamps where the controller recorded regeneration activity or set a related fault code.
Below is a practical checklist you can follow every time you review a log file:
- Confirm timestamps and align data streams (RPM, speed, exhaust temps, soot load).
- Identify regeneration events using status flags or temperature spikes.
- Compare soot load before and after the event to judge effectiveness.
- Check for related fault codes and note whether they coincide with regeneration attempts.
- Review ambient and engine conditions (e.g., short trips or city driving can prevent passive regeneration).
Practical tips, tools and best practices for technicians and owners
Select the right tools for reading and storing diagnostic logs: manufacturer diagnostic software, generic OBD-II readers with advanced logging, and aftermarket dataloggers all provide useful outputs. Export logs in a readable format like CSV so you can filter and visualize trends over time, which helps demonstrate chronic issues versus single-event anomalies.
Finally, when communicating findings to customers or colleagues, emphasize metrics that matter: soot load trends, exhaust temperature behavior during regeneration, and any repeating fault codes. Clear, data-driven reporting reduces unnecessary replacements and focuses repairs on the actual cause of failed DPF regeneration attempts.